This is a crosspost from VanessaSaurus, dinosaurs, programming, and parsnips. See the original post here.
It’s always been kind of hard to measure resource usage when you are running a script. What I’d want to do is not get metrics like memory, cpu, and io operations for an entire host, but rather for a specific process.
The Monitor Process Task
What I wanted to do was monitor not an entire node, or a python script, but a specific function that a user might be running. Toward this goal, I created the monitor pid task, where pid stands for a process id. It works in a few simple ways. You can run it as a task - meaning that watchme will schedule it to collect metrics for some (pre-determined) process id or name. Let’s say we wanted to create a watcher called “system” and then create a task to monitor slack:
$ watchme create system
$ watchme add-task system task-monitor-slack --type psutils func@monitor_pid_task pid@slack
and then I would use the watchme schedule command to specify how often I want to
collect metrics. The schedule will use cron to run the watcher at the
frequency you desired. What kind of result can you get? To give you a sense, here is an example
of a plot for one of the tasks from a a system watcher.
Yep, I created it, scheduled it, and forgot about it. It faithfully generates data for
me, a la cron:
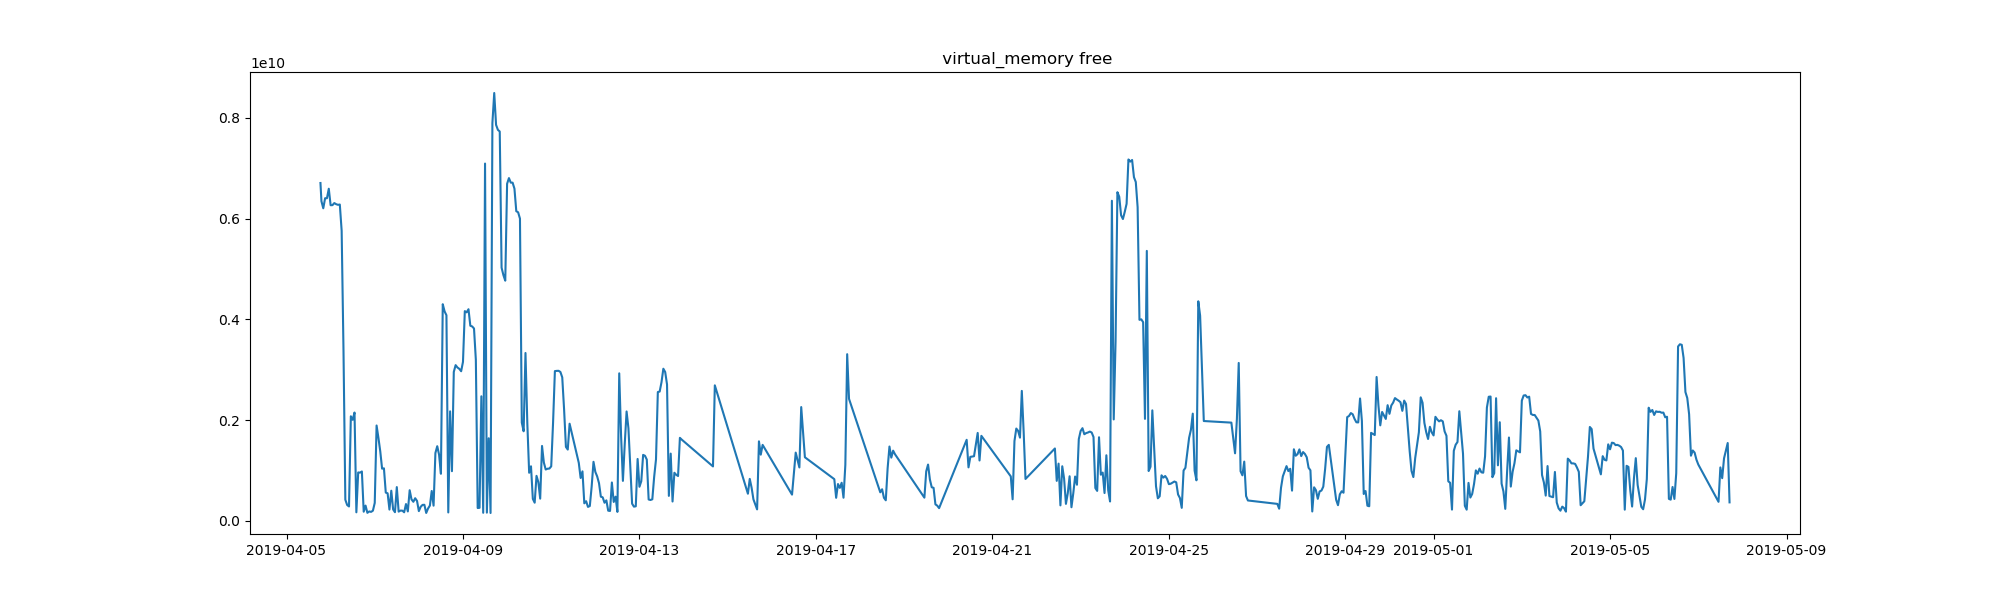
That’s the virtual memory that is free on my computer, in bytes, for the span of just over a month that the task has been running. It’s only a month of data, but there are still interesting patterns. What are the spikes? It could be that the spikes (more free memory) indicate a restart of my computer. It might also have to do with whatever I was running, here is a chart to show cpu percent usage:
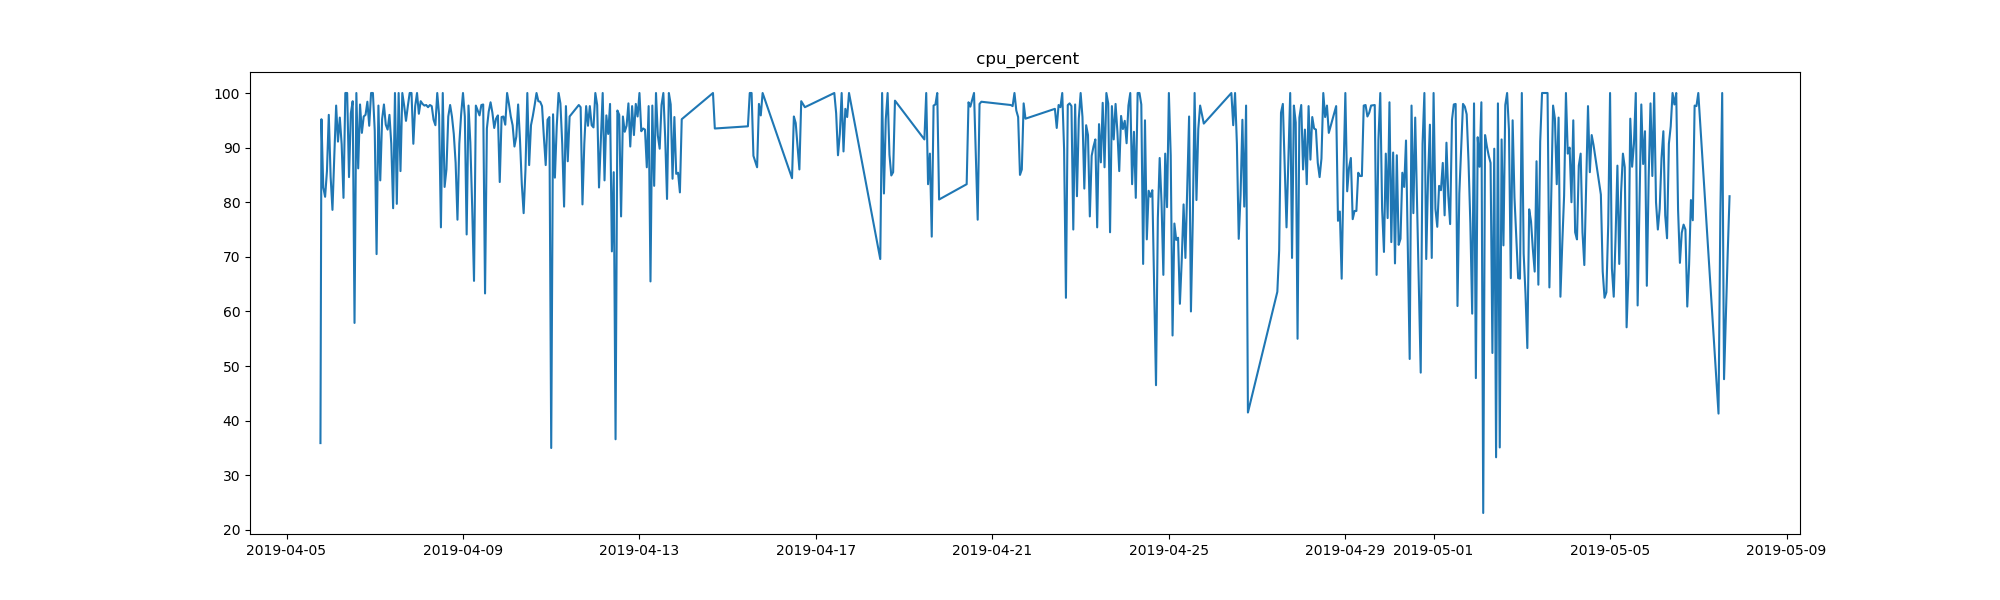
But I digress! With the monitor process task, you can create similar plots to these, but instead of for your entire computer, for a Python function or specific process that you are interested in. See an example here to see what is exported for each run. By the way, if you do run this task for slack, take a look at the “cmdline” key. The command used to start up slack is ridiculous.
The Monitor Process Decorator
The task is pretty cool if you want to schedule monitoring for a process name or id in advance, but what if you want to run something on the fly? I decided to solve this issue by way of creating a decorator. Here’s what that looks like:
from watchme.watchers.psutils.decorators import monitor_resources
from time import sleep

@monitor_resources('system', seconds=3)
def myfunc():
    long_list = []
    for i in range(100):
        long_list = long_list + (i*10)*['pancakes']
        print("i is %s, sleeping 10 seconds" % i)
        sleep(10)
You can add this decorator on the fly, and get results written to a watcher in your $HOME even if it doesn’t exist. For example, I could add this decorator to a long running job on my cluster, set a reasonable number of seconds to measure metrics as it runs (the default is 3), and then get my version controlled, programatically parseable data ready to go! A dummy example is provided here to get you started, and meaty example, discussed next, is also provided.
Watchme Sklearn
I decided to start with nice tutorial from here that goes over some classifiers for sklearn. My goal would be to create a monitor (a function decorator) for each one. Don’t forget to import the decorator!
from watchme.watchers.psutils.decorators import monitor_resources
And here is how I went about doing this.
1. Create Function Wrappers
I decided to plop each training into it’s own function, so a function might look like this:
# ----------------------------------------------------------------------
# MDS  embedding of the digits dataset

@monitor_resources('watchme-sklearn', seconds=0.25)
def mds_embedding():

    print("Computing MDS embedding")
    clf = manifold.MDS(n_components=2, n_init=1, max_iter=100)
    t0 = time()
    X_mds = clf.fit_transform(X)
    print("Done. Stress: %f" % clf.stress_)
    plot_embedding(X_mds,
                   "MDS embedding of the digits (time %.2fs)" %
                   (time() - t0))
Let’s talk about the decorator. The first argument “watchme-sklearn” is the watcher name. This watcher doesn’t have to exist on my computer. If it doesn’t it will be generated. The second keyword argument, seconds, indicates how often I want to collect metrics. Since these functions are really fast, I chose every quarter second. The default would be 3 seconds. This is just one of the functions - you can see all of the functions here.
2. Prepare to Run!
Then in this simple script, I could basically run all of the various plotting functions
when the script was invoked. See that the function above is called mds_embedding?
It’s one of many in the list here:
# ensure the function runs when the file is called
if __name__ == '__main__':
    plot_digits()
    random_2d_projection()
    pca_projection()
    lda_projection()
    isomap_projection()
    lle_embedding()
    modified_lle_embedding()
    hessian_lle_embedding()
    ltsa_embedding()
    mds_embedding()
    spectral_embedding()
    tsne_embedding()
    plt.show()
3. Run away, Merrill
For the above, I decided to make life easier and build a container. Building and then running this Singularity recipe looked like this:
sudo singularity build watchme-sklearn.sif Singularity
singularity run watchme-sklearn.sif

Adding watcher /home/vanessa/.watchme/watchme-sklearn...
Generating watcher config /home/vanessa/.watchme/watchme-sklearn/watchme.cfg

=============================================================================
Manifold learning on handwritten digits: Locally Linear Embedding, Isomap...
=============================================================================

An illustration of various embeddings on the digits dataset.

The RandomTreesEmbedding, from the :mod:`sklearn.ensemble` module, is not
technically a manifold embedding method, as it learn a high-dimensional
representation on which we apply a dimensionality reduction method.
However, it is often useful to cast a dataset into a representation in
which the classes are linearly-separable.

t-SNE will be initialized with the embedding that is generated by PCA in
this example, which is not the default setting. It ensures global stability
of the embedding, i.e., the embedding does not depend on random
initialization.

Linear Discriminant Analysis, from the :mod:`sklearn.discriminant_analysis`
module, and Neighborhood Components Analysis, from the :mod:`sklearn.neighbors`
module, are supervised dimensionality reduction method, i.e. they make use of
the provided labels, contrary to other methods.

Computing random projection
Computing PCA projection
Computing Linear Discriminant Analysis projection
Computing Isomap projection
Done.
Computing LLE embedding
Done. Reconstruction error: 1.63546e-06
Computing modified LLE embedding
Done. Reconstruction error: 0.360659
Computing Hessian LLE embedding
Done. Reconstruction error: 0.212804
Computing LTSA embedding
Done. Reconstruction error: 0.212804
Computing MDS embedding
Done. Stress: 157308701.864713
Computing Spectral embedding
Computing t-SNE embedding
Ta da! Done.
3. Oggle at Results
Here is a glimpse at what was created in my watchme home. Each function gets a decorator folder, and within each folder is a result.json file and a TIMESTAMP.
$ tree
.
├── decorator-psutils-hessian_lle_embedding
│   ├── result.json
│   └── TIMESTAMP
├── decorator-psutils-isomap_projection
│   ├── result.json
│   └── TIMESTAMP
...
├── decorator-psutils-tsne_embedding
│   ├── result.json
│   └── TIMESTAMP
└── watchme.cfg
Let’s step back and remind ourselves how watchme stores its data. It’s going to use the .git repository to store each data entry, where one entry might correspond with one function run. We would then use “watchme export” to generate a json export of this temporal data. For example, Here is how I would export data for just one of the decorators result files:
watchme export watchme-sklearn decorator-psutils-tsne_embedding result.json --json
And this is a subset of what gets splot on my screen, or directly to a file with the --out
parameter:
{
    "commits": [
        "72d6a9d1fc4b574e4d4063324b8a9dcb19b1b22e"
    ],
    "dates": [
        "2019-05-12 16:24:03 -0400"
    ],
    "content": [
        {
            "create_time": 1557692636.69,
            "cmdline": [
                "/opt/conda/bin/python",
                "/plot_lle_digits.py"
            ],
            "LABEL": "singularity-container",
            "SECONDS": "0.25"
        ...
        },
    ...
As with all watchme exports, since we are using git as a temporal database, we get a json structure with commits, dates, and content. The function was monitored multiple times, and each timepoint is an entry in the “content” list, all stored under one commit. Also notice that the interval (SECONDS) is a variable in the result, along with a custom label “LABEL.”
What is a custom label?
To allow the user flexibility in adding metadata to the result, any WATCHMEENV_*
prefixed environment variable is automatically added. For the variable above, I
exported the following in the Singularity container in the environment
section.
WATCHMEENV_LABEL=singularity-container
export WATCHMEENV_LABEL
You can see all of the exports in completion here - I put them in a data folder in the respository. Here is a programmatic way that I have used to export all results to a “data” folder in the repository:
mkdir -p data
for folder in $(find . -maxdepth 1 -type d -name 'decorator*' -print); do
    folder="${folder//.\/}"
    watchme export watchme-sklearn $folder --out data/$folder.json result.json --json --force
done
After I generated this folder, I pushed everything up to GitHub. WatchMe handles adding the result files, so I just needed to commit the exports that I created.
4. Run it Yourself!
Here is a final example for how easy it is to share your watchme decorated functions with others. I built this same container on Singularity Hub so you can pull it, and run it. And just for kicks and giggles, we will add an extra variable for the Singularity container to find.
singularity pull shub://vsoch/watchme-sklearn
export SINGULARITYENV_WATCHMEENV_avocados=aregreat
./watchme-sklearn_latest.sif
And seriously that’s it - go to your $HOME/.watchme/watchme-sklearn folder to inspect the results!
cd $HOME/.watchme/watchme-sklearn
watchme export watchme-sklearn decorator-psutils-tsne_embedding result.json --json
And yes, you will even see our avocados variable!
watchme export watchme-sklearn decorator-psutils-tsne_embedding result.json --json | grep avocados
            "avocados": "aregreat",
            ...
Check out the git log to see everything recorded for you:
git log
commit 6f10453a429ab3e2ad835520443bf127c466ac40 (HEAD -> master)
Author: Vanessa Sochat <vsochat@stanford.edu>
Date:   Sun May 12 18:02:08 2019 -0400

    watchme watchme-sklearn ADD results decorator-psutils-tsne_embedding

commit b53b4ab7896b1668fa3562334db633431170bb6f
Author: Vanessa Sochat <vsochat@stanford.edu>
Date:   Sun May 12 18:02:08 2019 -0400

    watchme watchme-sklearn ADD results decorator-psutils-plot_embedding

commit 9aa96290f4bd1b45e33f54a050899f1adaf308f1
Author: Vanessa Sochat <vsochat@stanford.edu>
Date:   Sun May 12 18:02:02 2019 -0400

    watchme watchme-sklearn ADD results decorator-psutils-spectral_embedding

commit e0ad2d079a74794e0ccb2c14e9cd368356074774
Author: Vanessa Sochat <vsochat@stanford.edu>
Date:   Sun May 12 18:02:02 2019 -0400

    watchme watchme-sklearn ADD results decorator-psutils-plot_embedding

commit efbccc4bbe58d81597588cc268f91e5809986122
Author: Vanessa Sochat <vsochat@stanford.edu>
Date:   Sun May 12 18:02:01 2019 -0400
...
And at this point you would add a README, and then just create a GitHub repository to push to, and push. Is that cool or what? Obviously, we’d want to use the decorators for more interesting (longer) tasks, possibly on HPC. If you have something in mind, please reach out and we can put together an example to run!