This is a crosspost from VanessaSaurus, dinosaurs, programming, and parsnips. See the original post here.
In a Nutshell
If you don’t have time to read the below:
- Generate your phenotype here. We want to know how you define your craft so we can best support your goals.
- Share your phenotype image on GitHub here
- Post the text presented by the GitHub action on merge to share with the community, and enter in a giveaway!
The Research Software Engineer Phenotype
On the us-rse.org we describe an inclusive definition of what it means to be a research software engineer, or RSE. It generally means you use practices from software development to advance research. But what if you also do a lot of open source development? Or research on your own? What if you serve multiple communities?</p>
Why the RSE Phenotype Generator?
It wouldn’t be right to say that an RSE must fall within a strict set of categories, or dimensions. Nor would it be correct to assume that all RSEs serve the same user communities. This is the reason that this tool exists - with the RSE Phenotype generator you are the one that gets to decide the dimensions that are relevant to you (open source and research? high performance computing and software engineering? Documentation and testing? Something else?) along with the communities that you serve, for which you could provide a score for each dimension.
How do I participate?
If you self identify as an RSE, we want to understand the work that you do! We need the help of the community to paint a picture of all the different kinds of RSEs that are out there. With this general information, the USRSE organization can better support you. To participate, use the generator to create an image the describes your role, where:
- Dimensions: is a comma separated list of the facets that describe your work. It could be as simple as software engineering, research, and high performance computing. It might be something else.
- Groups: is a second comma separated list of the groups or communities that you serve. For example, you could do a large chunk of software engineering for an open source community, and then provide research support for an academic community. The idea is to give a score for each dimension, and for each community.
- Name: is a title for the plot!
Once you have finished your image, export it and a link will open up where you can upload the newly downloaded image direcly into a pull request! When the pull request is merged, you’ll see some nice text that you can share on Twitter

And guess what? We will be selecting one tweet at random to win a prize!
If you want to see the code for the generator, it’s all on GitHub! Also, the GitHub action is really cool! You can use it to generate your own post merge tweets by following the instructions here.
Talk about Your Phenotype
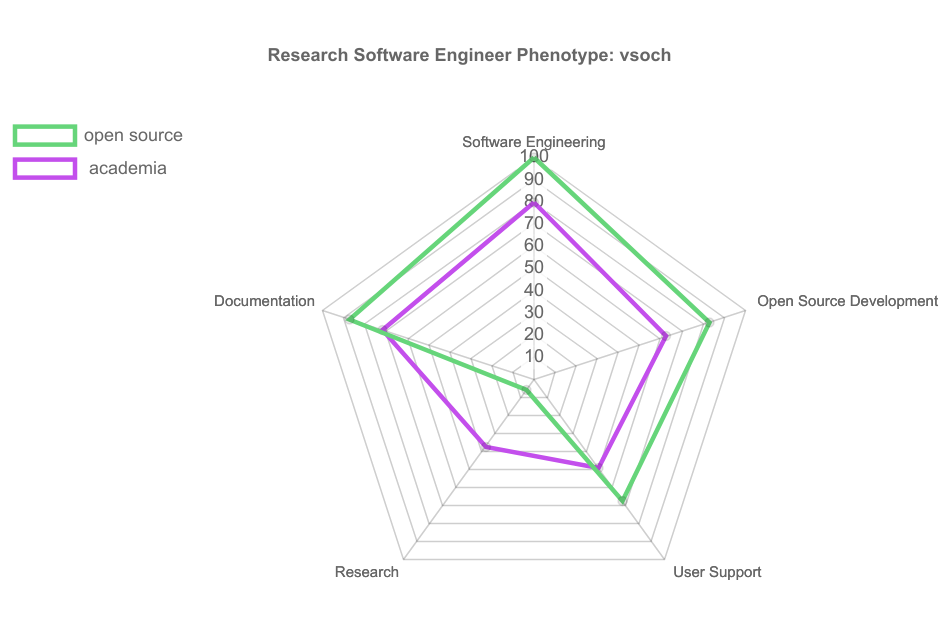
Sharing is enough, but if you want to better articulate how you feel, tell us about it! For example, here is mine:

In the above, you see the communities that are important to me - namely the academic communities that I serve, and a closely related set of open source communities that work on software for reproducible, sustainable research. Within those two groups, I see my primary facets being software engineering, open source development, a little research on the academic side, and of course working on documentation and user support. However, this is totally my bias! And I can’t say for sure that my thinking won’t change in the future, but this is how I feel at this moment. I think it will look quite different for different RSEs, and I can’t wait to see yours.
In the future, it would be fun to have some sort of quiz to take to generate the plot, but that would rely upon known dimensions, which of course, we don’t know.
Resources
- The Research Software Engineers Association
- The US Research Software Engineering Community
- USRSE on GitHub
- US RSE Community Starter Pack
- Stanford Research Software Engineer Community of Practice