This is a crosspost from VanessaSaurus, dinosaurs, programming, and parsnips. See the original post here.
For those interested in data science that might be member or admin for a Discourse community, I wanted to provide something to get you started with analyzing your content. What kind of questions might you ask?
- How do topics cluster based on content?
- Can we cluster based on tags to see how well we are tagging?
- Is some variable (e.g., likes) associated with views?
This comes down to exporting posts using the discourse API, creating a container to run a Jupyter notebook for with dependencies that I need, and then exporting data to json to generate (much better) d3 plots. I wanted to answer these questions for AskCyberinfrastructure, and I knew that I didn’t have much data, so it would be a first analysis that might be re-run as the community grows over time.
If you have a community with a lot of data, I think you can generate some awesome plots, and should give it a try!
Reproducibility?
While this was a quick project and the steps for reproducibility aren’t perfect, I decided to organize data exports based on the export date:
$ tree data/2019-10-19/
...
├── ask.cyberinfrastructure.org-q-a-tags-2019-10-19.json
└── ask.cyberinfrastructure.org-q-a-topics-2019-10-19.json
and build (and push to Docker Hub) a container that is tagged based on the date as well. If an interested party wanted to reproduce or otherwise interact with my notebooks, they could pull and run the container.
$ docker run -it -p 8888:8888 vanessa/askci-cluster-gensim
See the repository for complete instructions. The export script is simple enough (it only requires standard libraries) so I didn’t choose to include it inside the container. I’ll also note that if you are trying to use the ruby gem to get all your topics, you will run into the same issue I did.
Too Long, Didn’t Read
Of the three bullets above, I worked through the first two, and I’ll lay out how I would go about the third for an interested person. If you want to jump to the plots go to hpsee/discourse-cluster, and for the data (to perform your own analysis, and possibly answer question three!) see the repository.
1. Clustering of Topics
For the first analysis I wanted to use a library that I was fond of in graduate school for NLP called Gensim. Gensim (in Python) is a library for extraction of semantic topics from documents. We are going to use it to cluster the extracted topics from AskCI. What does this mean?
- Start with raw text from topics (a topic is made up of smaller posts, we'll combine them)
- Clean up the text (html, links, punctuation, stopwords, etc.)
- Generate embeddings for each using Doc2Vec
- Cluster embeddings to find semantic structure of posts using TSNE
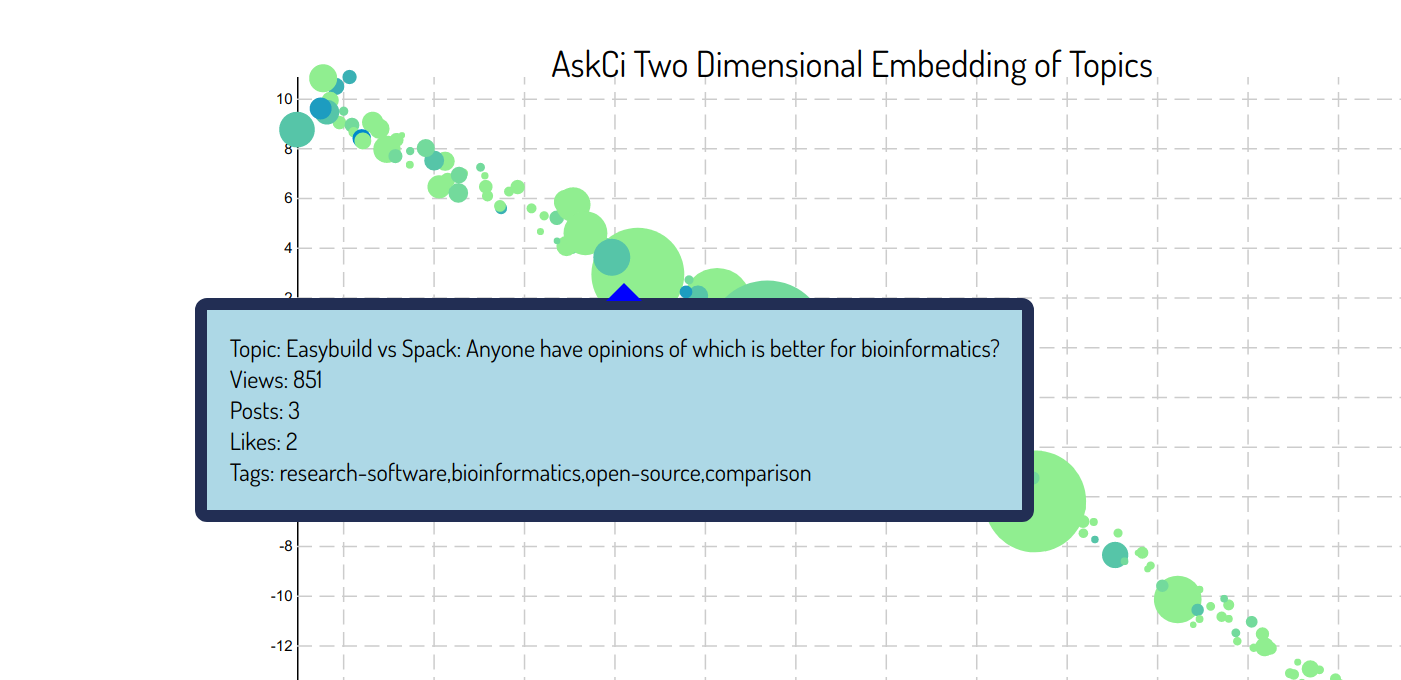
For those not familiar with Discourse terminology, a “topic” is one page of posts by multiple users to answer a question of interest or discuss an idea. In the case of AskCI, we have Question and Answers topics (category Q&A) and Discussion Zone topics, and for the purposes of the analyses here, we combine the page of posts into a single text entry to represent the topic. Here is an example of a topic, and notice that it’s made up of multiple posts by different users. The algorithms we will be using are unsupervised, meaning that we don’t need to provide any labels for training. For TSNE, we choose two dimensions so it’s easy to plot. And in a nutshell, here is the TSNE result!.
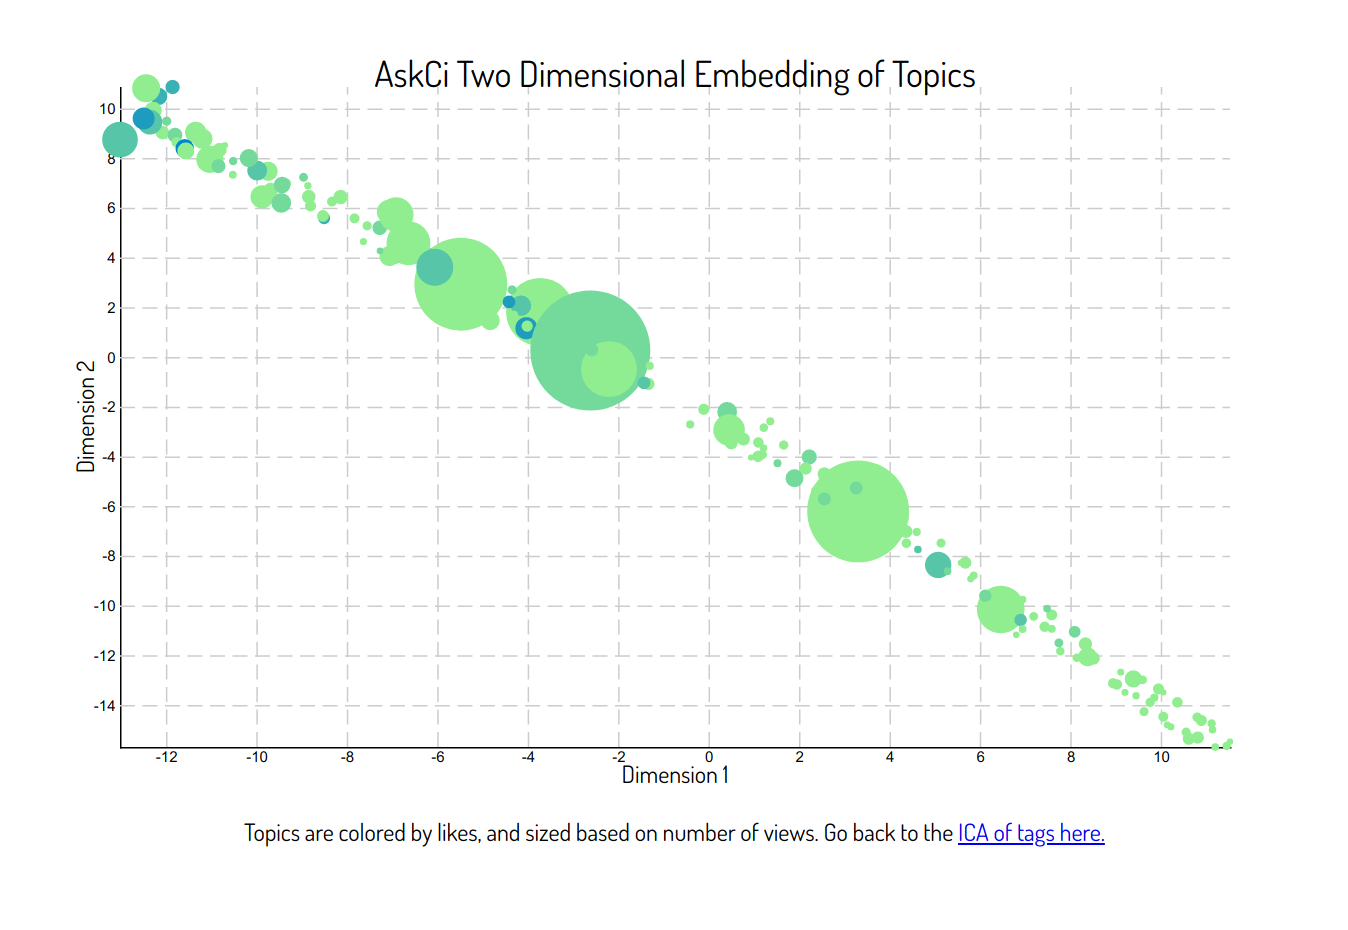
What do you see?
As we mentioned above, there isn’t much data to work with (N=179 topics total, some with only one post) so I’m not surprised to see that we only see a straight line to represent the structure of the data. The result (I think) is still interesting, because given that the circles are sized based on view counts, and given that they are colored based on likes, it (maybe?) seems like the upper left quadrant has topics that are both more well liked and viewed. We could look at the specific posts (and mouseover or click on them on the live plot) to see exactly the content.
It could be that (some of) the posts in the upper left really have some quality that makes them better. Or it could just be that they are older and thus have more views and likes for that reason. I’m going to stop here, and give you a chance to look at the data and come to your own conclusions.
2. Clustering by Tags
For the second idea, I wanted to visually see topics clustered by tags, and verify (for myself) if the groups made sense. A lot of time and energy goes into tag curation, so this is a quick sanity check to see how we are doing. I proceeded as follows:
- Create a count matrix of topics by tags
- Perform dimensionality reduction on the matrix (ICA) with 1..10 components
- The mix of signals (topics by components) can be visualized again with TSNE
I didn’t take the time to think about how many components to derive (there are methods, I’m not sure any or great) so I instead derived a range (1..10) and you can explore on your own.. Here is a static image of the plot (no you cannot click on this, but try the link!)
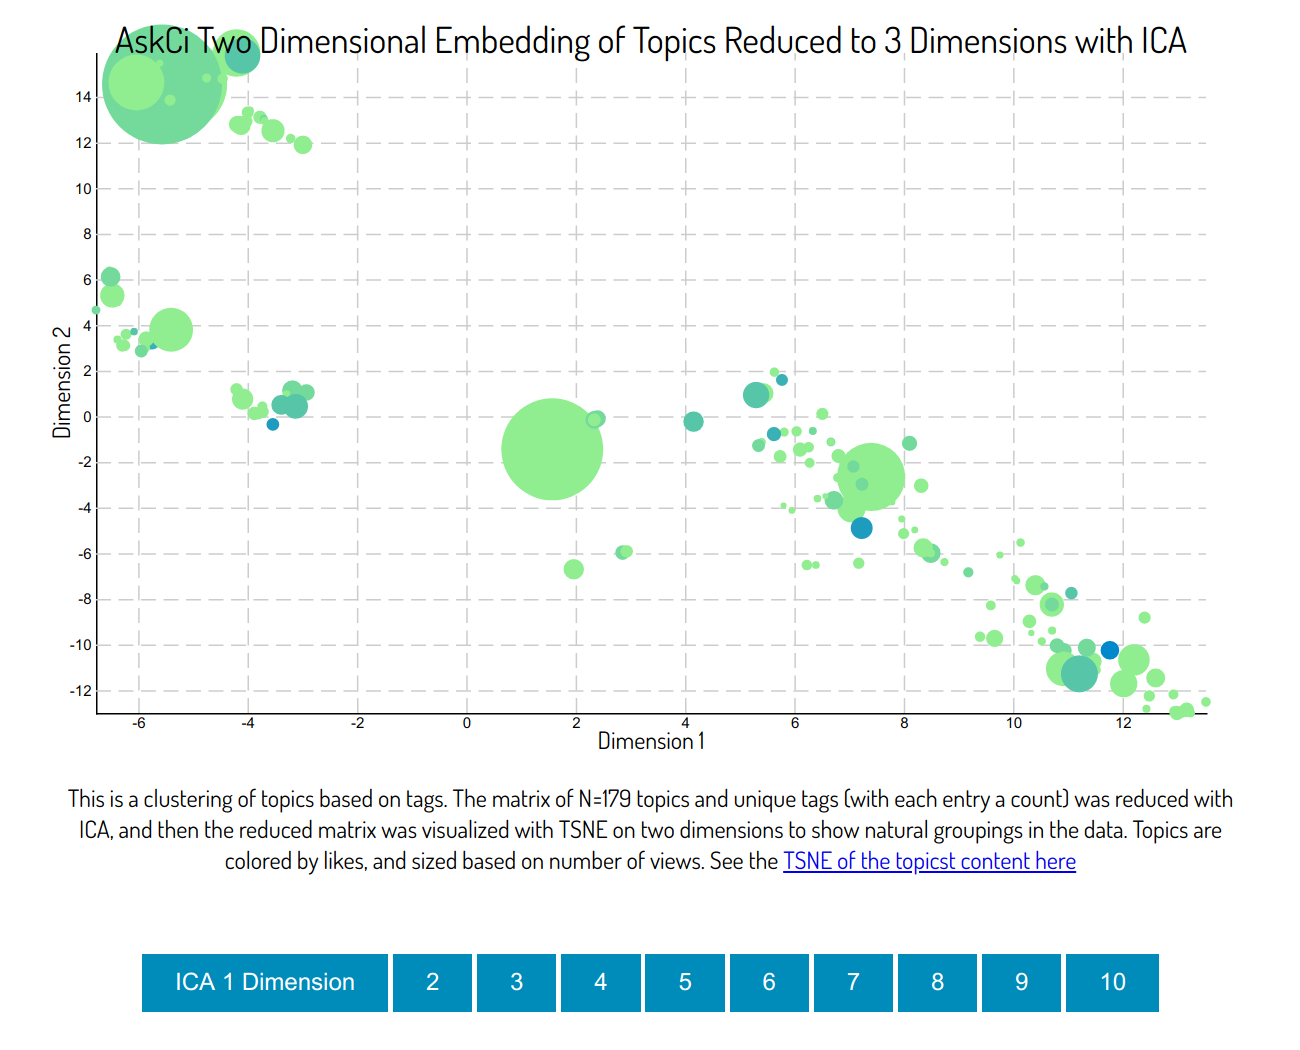
What do you see?
I think that 3 components has a (sort of?) better grouping, but again, the dataset is just really small. The top left seems to be somewhat about slurm and schedulers, and there is a cluster in the middle toward the right with lots of posts about containers. I would again be skeptical that the tags themselves are indicative of the number of likes or views - I think there are other variables not taken into account like how the topics were shared, and who posted.
Another view to look at is with 10 components, and perhaps we might have gone higher given that this could be meaningful. Roughly, the idea is that if we use N ICA components, we can capture N clusters. What do we see here?
- The left chunck is all parallel stuff.
- A chunk in the middle doesn't have tags.
- The bottom is heavily slurm
- The bottom right has questions of the week.
- To the right is network and file transfer
- The top right is getting started.
- There are some smaller, more specialized clusters, e.g., computational chemistry, environments)
Cool!
3. Make Predictions
This is the third idea that I didn’t pursue, because this dinosaur has other things she wants to work on this weekend! But I figured I might share the idea, in the case that someone wants to give it a try, either with the data here, or their own community. The idea is that we might want to predict a variable like views to better understand what makes a topic good. Here is how you could go about that.
Organize X Data
Organize the input data (X). For example, make a sparse matrix of shape (number of topics, number of unique tags). Actually, you can use the CountVectorizer method that we used to create the matrix of tag counts, but instead of tags as input, provide the entire content of the topic.
Organize Y Data
Organize the output (y) values. This is the list of things that we want to predict, such as views or likes. You may also consider taking the log (e.g. log(views)) because the distribution seems to have that form. If you do take the log (numpy.log uses natural log), remember you’ll need to take the exponent of the predictions (numpy.exp).
Train/Test Split
Now it gets hairy because our dataset is small. Ideally we would have a large enough dataset to use a section for training and another for test, but we don’t, so we instead might try some kind of K-fold cross validation (and vary the value of K). If you want a quick and dirty look you can use all of the data for training (ug) but more correctly you should loop over testing and training sets, and generate some kind of summary metrics for how well you did.
Train Regressor
Next you’d want to train a regressor on the training set, and I think the functions usually have a score to look at.
Evaluation
If you did do some kind of hold out, evaluate to see how you did. You can compare model predictions to actual values, and then create a scatter plot (x-axis is actual values and y-axis is predictions).
Another Idea?
An entirely different option is to train using the embeddings that we generated in the first notebook. Really, the thing I find so hard about this kind of work is that there isn’t an exactly right way to do it. And it’s not even clear when you are done. This is why I decided to stop at two bullet points.
Why?
I’ve noticed that a lot of communities use Discourse for discussion and general support, and it’s important that those communities are empowered to use their own data to better understand what constitutes a “good topic” or if the content is organized logically. I can’t say this is the only or even close to a best practices method (I’m a terrible scientist, and data scientist is included in that), but my hope is to get others minimally started with using the API to export data, and then interacting with it.